The RAGE Analytics platform, one of the main results of the H2020 RAGE project (GitHub repository) has been extended to adequate its functionalities to the IMPRESS project needs. More precisely, the platform has been extended to support different types of educational activities that can generate analytics, or at least, different metrics that could be interesting from the educational point of view (see related publication).
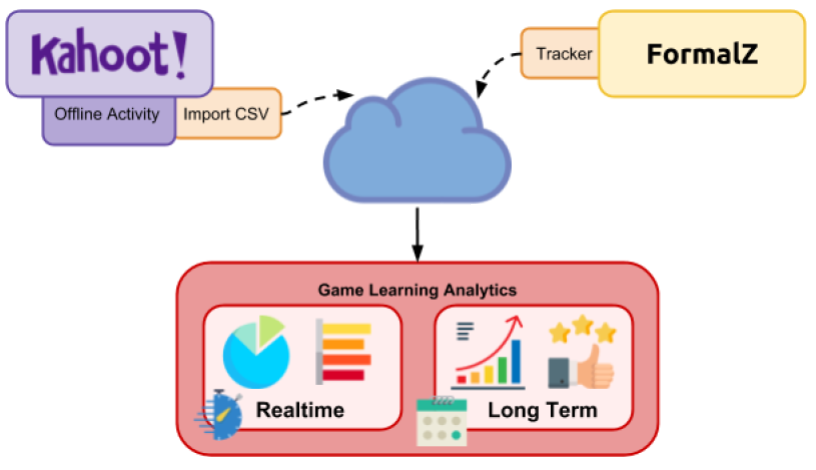
These new features allow teachers to add different type of activities to their classes (a class inside RAGE analytics is like a moodle course, that is, where teachers add different educational activities). In addition, these new developments allowed two approaches for analytics integration: light and deep integrations (see Figure 1). The first approach is a light integration where the educational tool it is not modified at all (usually because that modification is not possible) and our platform takes advantage of the already available analytics provided by the educational tool. Usually, educational tools (like Kahoot!) provide a report that summarizes students interaction to some extent (depending on the tool the report can be just a final score or more detail metrics / analytics). Now it is possible to upload into RAGE Analytics these interaction reports so all learning analytics are stored in one place.

Moreover, we have defined a generic data model and a CSV format that can be used to integrate any tool, so a teacher can use any tool they want and integrate to analytics. However this integration has a shortcoming, that is, it may require the teacher to transform the specific tool report into the CSV format. Because the use of Kahoot ! was foreseen to be used in IMPRESS, an specific translation Kahoot activity type was created inside the improved RAGE Analytics platform, so teachers only need to upload the report files that are generated by Kahoot !.


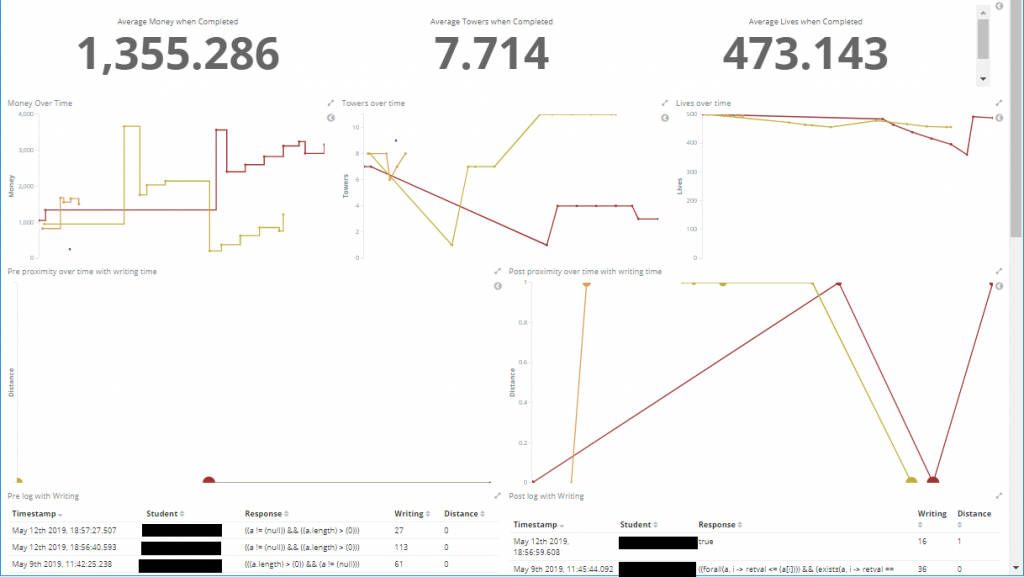
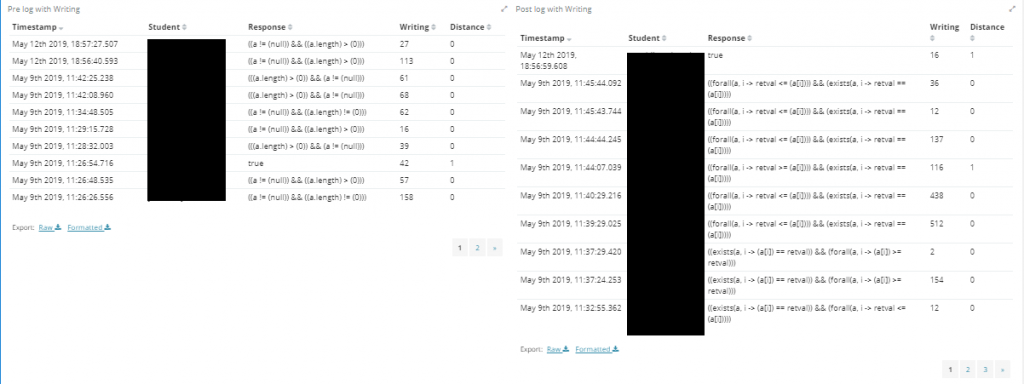
The second approach it is a deep integration between the specific educational tool and RAGE Analytics that is usual way of integrating serious games. This approach requires the serious games developers to integrate a “tracker” (e.g. a library module that hides most of the complexities of the integration) during the development to send out the user interaction information. But in contrast to the light integration, with this approach, it is possible to provide more fine grained analytics and also to provide them while the activity is happening (near real-time analytics). This later was the approach selected for integration of FormalZ serious game with RAGE Analytics, allowing us to collect all students / players interactions but also to provide a near real-time dashboard (see Figure 2) to teachers so they can use that information during game sessions (even to identify a specific student that is having troubles using FormalZ game) to facilitate their teaching support and retain the control during the activity.
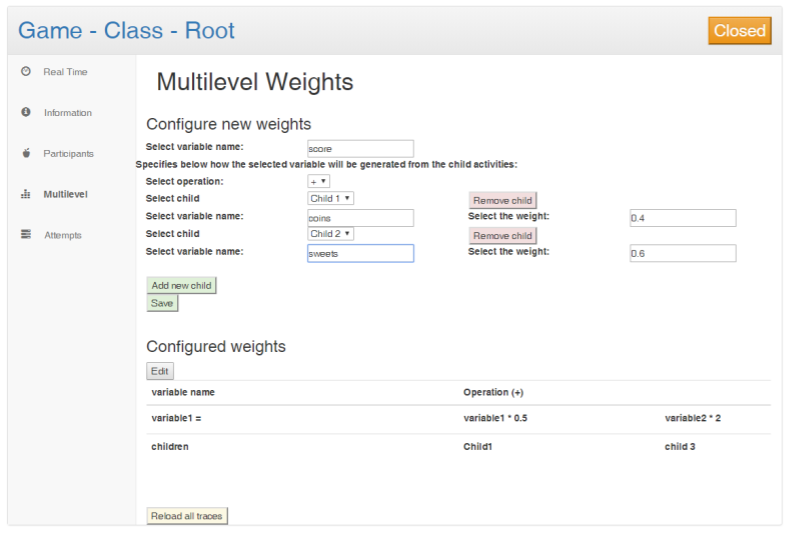
Having all analytics in one place allowed us to provide an additional capability for teachers that want to have analytics of multiple heterogeneous activity (e.g. to track student progress during a longer period). In this case we provide the teacher with a simple configurator where it is possible to perform simple operations and weight of activities, so they can build new variables that can be included in class level dashboards.

Finally, although it is possible the get access to the analytics dashboards from the formal Z platform, if the teachers want to have access to the all the analytics features need to access the RAGE Analytics platform. In order to facilitate this process and provide a seamless integration, whenever the teacher creates rooms in FormalZ a classes are created in RAGE Analytics, moreover whenever students / teachers are created / enrolled in a formalZ room the same user (same identity to be precise) is created / enrolled inside RAGE Analytics. This way, it is possible to transition between formalZ and RAGE Analytics (maintaining the coherence between systems) in a easy way.
